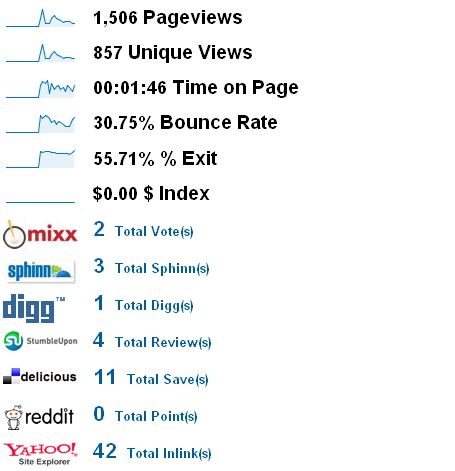
The other week, Brian Clifton wrote a very neat article on his well-known blog about tracking social networks by using filters. The data I got from the implementations he recommended in that article made me want to obtain even more “actionable data”.
So I went a little deeper into it and, after some tricks and implementations, I decided to share the findings with you. So here goes my second article for the series: 10 things you (probably) didn’t know about your visitors. If you missed the first one about visitors that lost their way, check it now.
This post tries to answer the following questions:
- What’s wrong with the data I already have?
- How to tweak it?
- How to use the new reports?
- What actions to take?… at least a couple of examples :)
What’s wrong with the data I already have?
First of all, referring sites are of all kinds and sorts. It just isn’t fair to put all of them together. Imagine if you couldn’t get paid keywords differentiated from organic searches keywords. How happy would you be then? Brian Clifton’s implementations are just about great as long as you are interested in the major trend, but it just isn’t right to put Twitter (haven’t tried twitter yet?)and LinkedIn in the same pot. Users coming from these 2 social networks can be segmented and therefore treated differently.
What we need is a way to get both trends, therefore, see how you are doing lately on social networks and which social network gets you better value: should you spend more time on Facebook or Twitter?
And here is even more: Google Analytics now allows you to compare up to 4 segments between them. Here’s something cool to compare: Social networks vs All Visits vs Paid visits. I did that and the results I got were amazing. In my case, the Bounce rate for Social Networks was under 40% and way lower than the global bounce rate. However, only 4 conversions occurred from social networks. At least I know what needs to be improved. :)
How to tweak it?
For the tweaking some technical implementations are needed, but that’s why I am here.
Here is what you need to do:
- Get into the Analytics Dashboard of any of your websites or profiles. In the right upper corner you will see the Advanced Segments Beta button. Press it and click on the Create New Advanced Segment link.
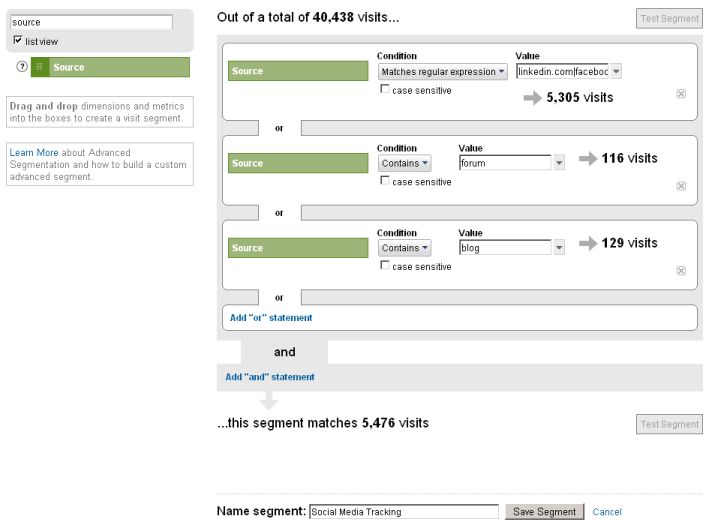
- Once you get in the Advanced Segment Creator, fill it up just like in the following image.
Here is what I added in the first Source Value Box:
I created the second and the third source segmentation settings in order to cover all blogs and forums.
Just before you save the settings click on the Test Segment button to see if everything looks good. Remember, red is for errors! :)
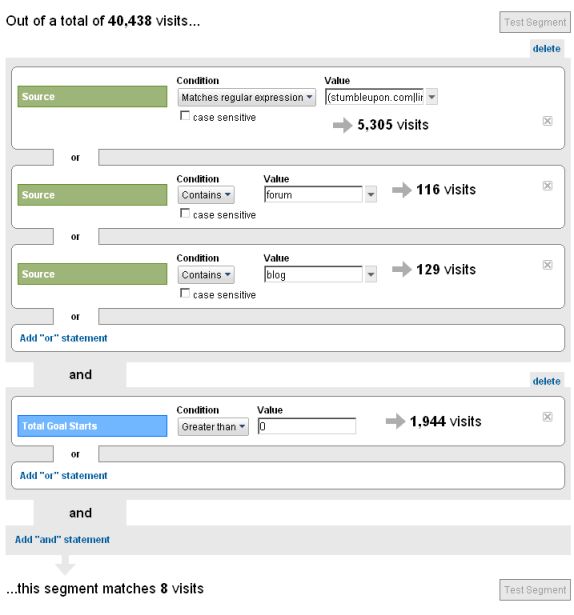
That’s it. Just follow the above 2 steps and you get a great new report. Let’s take it even further (I like this cause it gives me a good insight even without looking at the data). Check out the following image:
Just clicking on the test segment on the above setting I see that only 8 users got to start a registration form. None of them finished it. I heard many industry people saying that social networking traffic doesn’t convert much, that social networks just provide booms of traffic for short times and so on.
I am not actually going to buy that and I’ll do my best to provide great experiences for all of these users coming from the social networks. What one needs to do is to figure out a neat way to approach this type of traffic. They might not be your buyers, but they surely might be the Sneezers (people voicing out about your products or company).
How to use the new reports?
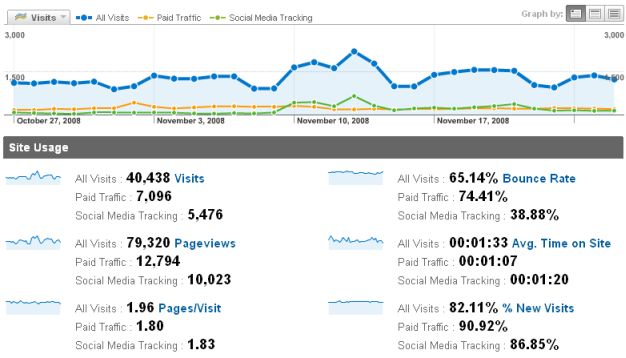
For a start, don’t look at the data just as it is. Compare it with all your traffic and, why not, with the paid traffic. Organic searches are a good alternative just as well. It’s less than 3 seconds to get really cool data: just choose the segments to compare and this is what the Site Usage dashboard section will provide:
It’s not very difficult to spot that the paid traffic the websites get is around 20% higher than the traffic coming from social networks. However, all the other numbers look much better. More time spent on site, lower bounce rate, more returning visitors for social networks. I know for a fact that this website has invested similar time on both paid traffic as well as article and blog posts writing.
Looking only at this, one would advise to quit on the paid traffic and focus all your efforts on good quality content distribution. You mustn’t hurry. Don’t forget to check out the conversions as well. In this case, while it has a high bounce rate, paid traffic brings also a pretty good conversion rate. Actually a very good conversion rate, as the ROI is quite good.
What I would suggest to this website is to try to benefit from the results it got from the social networks and use similar strategies to lure in the users coming from paid traffic. They might not be buyers, but you should give them the means and reasons to remember you.
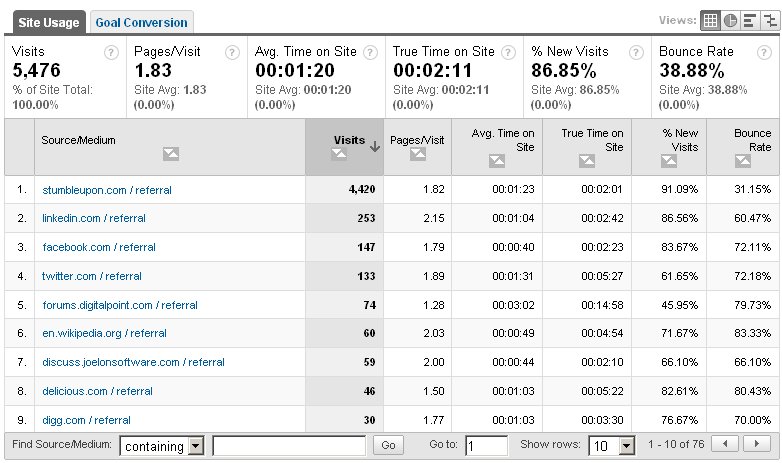
The next thing I suggest is to go and look into how every social network contributes to your numbers. Check out the following report:
In the above case, stumbleupon.com proves to be the best friend for the selected website. So, how come you get so many visits from Stumbleupon? This social network doesn’t have a neat tool to discover how a certain domain is doing on it (Twitter has this) so I just go to google.com and search for the following query if I want to discover all the users sharing pages about my company:
site:stumbleupon.com inurl:yourbrandname
Take the top 10 communities that bring traffic towards your website. Login to your account and start interacting with the users already creating buzz around your blog, products or services.
I’d stop here but there is only one more thing I would like to show you. I can’t help it.
So far, we studied the trend of social networks traffic, what social network is of best value for you, but we didn’t talk about content. Content is king, especially when talking about social networks.
Going to the Content Overview, you will be able to see what pages are most visited by users coming from social networks. In other words – what users consider hot on your website. Besides giving you an idea of which article topics work and which don’t, with a little Greasemonkey hack you can get to see exactly who loves you and who doesn’t.
Clicking on all the links above will get you directly to the social network you are interested in and see all the reviews or votes and the users that gave them to you. If this isn’t actionable data, then what is?
What actions to take?
- Make sure the buzz around you doesn’t get out of control. Bad reviews are really bad when you don’t know about them. If there is a community around your products, make sure you are part of it… no matter how many accounts you have to manage or what your rank inside the company is.
- Always do better. Check out what is the most loved topic in social networks about you, see the comments it gets and, based on that, write even better and greater content. Listen to the community. Most of the times it really is loud and clear.
- If social network traffic does not bring you customers, find a way to bring value to you. Give them a free and really cool tool and next time somebody asks them if they know somebody who sells a product like yours, rest assured they will talk about you. And if you come up with a neat tool, don’t forget to track it.
- Google Analytics Data is only a hint of what is out there. It just provides the directions. Follow them. The real data you get from there not from Google Analytics.
So far, these are my 2 cents on social networks traffic tracking. How do you track social networks and what do you look for? Is there an action you took that really made a difference to the final results?
Stay tuned for the next thing that you (probably) didn’t know about your visitors.


