Owning an online store gives significant chances for success in today’s dynamic digital landscape. However, with high levels of competition and ever-changing consumer behavior, store owners must stay ahead of the game.
The key to eCommerce success is tracking the right metrics.
You’ll be like a ship without a compass if you overlook the critical variables in your business. This results in wasted opportunities, income, and, ultimately, business failure.
So, if your success (or lack thereof) depends on tracking key indicators in your organization, why doesn’t everyone do it?
The Answer Is Simple: Determining Which Variables and Data Points Are Most Important Can Be Difficult.
Metrics provide critical insights into the success and health of your online store in an environment where every click, conversion, and consumer engagement matters. They are a compass for your business strategy, allowing you to optimize everything from inventory management to marketing campaigns, customer experience, and more.
Neglecting careful metric monitoring in any online business can lead to unforeseen risks, such as rising abandoned shopping carts and declining consumer satisfaction. Timely intervention and effective metric monitoring are essential to mitigate these issues and avoid negative impacts on reputation and sales.
The following sections will examine some of the most critical eCommerce statistics and metrics every business owner should watch. These indicators will enable you to make data-driven decisions to propel your online store to success, from finding bottlenecks in the sales funnel to managing inventory levels.
Understanding Metrics vs. KPIs
Metrics are quantitative data points that track different areas of your eCommerce operations and provide insights into performance. Sales revenue, conversion rate, web traffic, and other factors are among them. Key Performance Indicators (KPIs) are precise measures that are connected with your business goals. They serve as benchmarks for evaluating performance and tracking progress.
While metrics encompass a wide range of data points, KPIs concentrate on the most crucial signals. They assist you in prioritizing and aligning your activities with strategic goals. For example, if you want to boost client retention, KPIs like customer retention rate or repeat purchase rate will show you how far you’ve come.
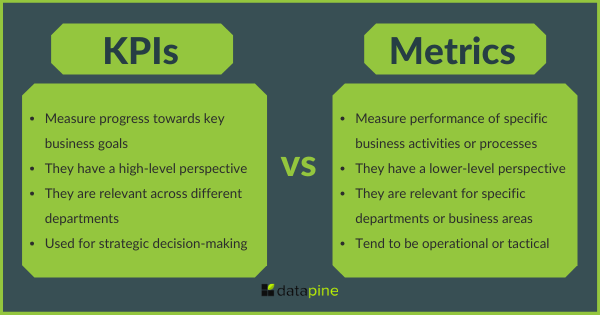
Understanding the distinction between metrics and key performance indicators (KPIs) is critical for effective analysis. Metrics provide significant insights, but KPIs focus on critical strategic indicators.
How Often Should You Check Store Metrics?
Once you understand the importance of monitoring eCommerce reports and metrics, the next critical question is: How frequently should you check them? Finding the correct mix is essential for ensuring timely insights while not being overwhelmed by ongoing analysis.
The regularity with which you review your store’s metrics is determined by various factors, including the size of your business, the industry in which you operate, and your individual goals and objectives. However, the following general recommendations will assist you in determining an acceptable monitoring cadence:
- Daily Monitoring: Certain metrics necessitate regular monitoring to discover immediate difficulties or opportunities. Some examples are website traffic, conversion rates, abandoned carts, and customer care response times. By checking these metrics daily, you can promptly identify any irregularities, take corrective action, and maintain a positive consumer experience.
- Weekly Analysis: A weekly assessment of key performance indicators (KPIs) allows you to acquire a broader perspective on the overall performance of your store. Metrics like sales income, average order value, customer acquisition cost, and social media engagement can be used to spot trends, patterns, and opportunities for improvement. This frequent review assists you in making educated decisions for the future week and adjusting marketing or operational strategy as appropriate.
- Monthly Check-Ins: Monthly check-ins provide a more detailed picture of your store’s long-term success. It lets you delve deeper into KPIs such as customer lifetime value, inventory turnover, marketing campaign ROI, and overall profitability. Monthly reviews aid in identifying general patterns, assessing the efficacy of strategic efforts, and making data-driven decisions to achieve long-term success.
- Quarterly and annual evaluations allow one to take a step back and examine your store’s performance more expansively. You could find seasonal patterns, assess progress against long-term goals, and plan for future growth by evaluating year-over-year indicators. These reviews also aid strategic planning, budgeting, and resource allocation for coming quarters and years.
It is crucial to emphasize that while these recommendations serve as a starting point, flexibility is essential. Depending on the conditions, such as large marketing campaigns, product launches, or fluctuations in industry trends, your monitoring frequency may need to be altered. Furthermore, utilizing automated reporting and analytics solutions helps speed the process, allowing you to efficiently access critical indicators and focus on data analysis and decision-making.
Essential eCommerce Metrics: Understanding Key Indicators for Store Success
Monitoring and interpreting significant metrics is critical for online store owners who want to improve performance, increase sales, and maximize profits. These metrics provide useful insights into numerous areas of an online store’s operations, ranging from website speed and traffic to conversion rates, client acquisition cost, and customer retention.
Website Speed and Performance
According to Statista, that is a significant increase in customers leaving a website without taking action if load times exceed 5 seconds.
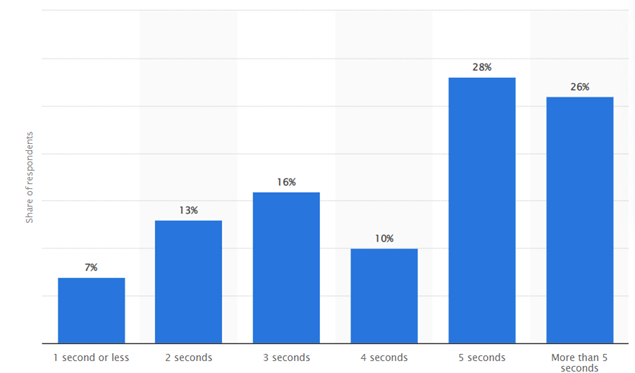
The speed and efficiency of your online store loads and functions are called website speed and performance. Slow-loading websites can lead to high bounce rates and disgruntled visitors, which is critical for store owners. A speedy and responsive website improves user experience, engagement, and the possibility of conversion.
Website Traffic
The number of visitors to your online store is measured by website traffic. It is an essential indicator for store owners since it shows the reach and visibility of their company. Store owners can gauge the efficiency of their marketing activities, spot patterns, and make data-driven decisions to attract and keep visitors by tracking website traffic.
21% of business owners report low website traffic. It is vital to understand what drives traffic to your site and how you can influence it.
Click-Through Rate (CTR)
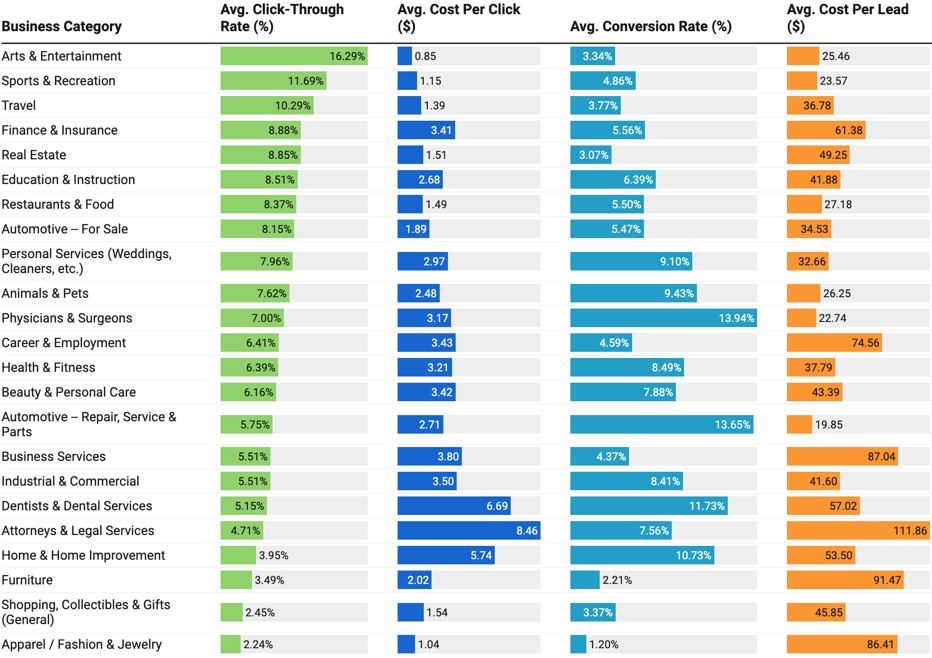
CTR measures the percentage of users who click a certain link or advertisement. It is helpful for store owners since it gives information about the efficiency of their online advertising campaigns and other organic initiatives. Monitoring CTR aids in the optimization of marketing strategies, the improvement of targeting, and the increased likelihood of delivering quality visitors to the store.
CTR can vary by industry, as the graphic below shows.
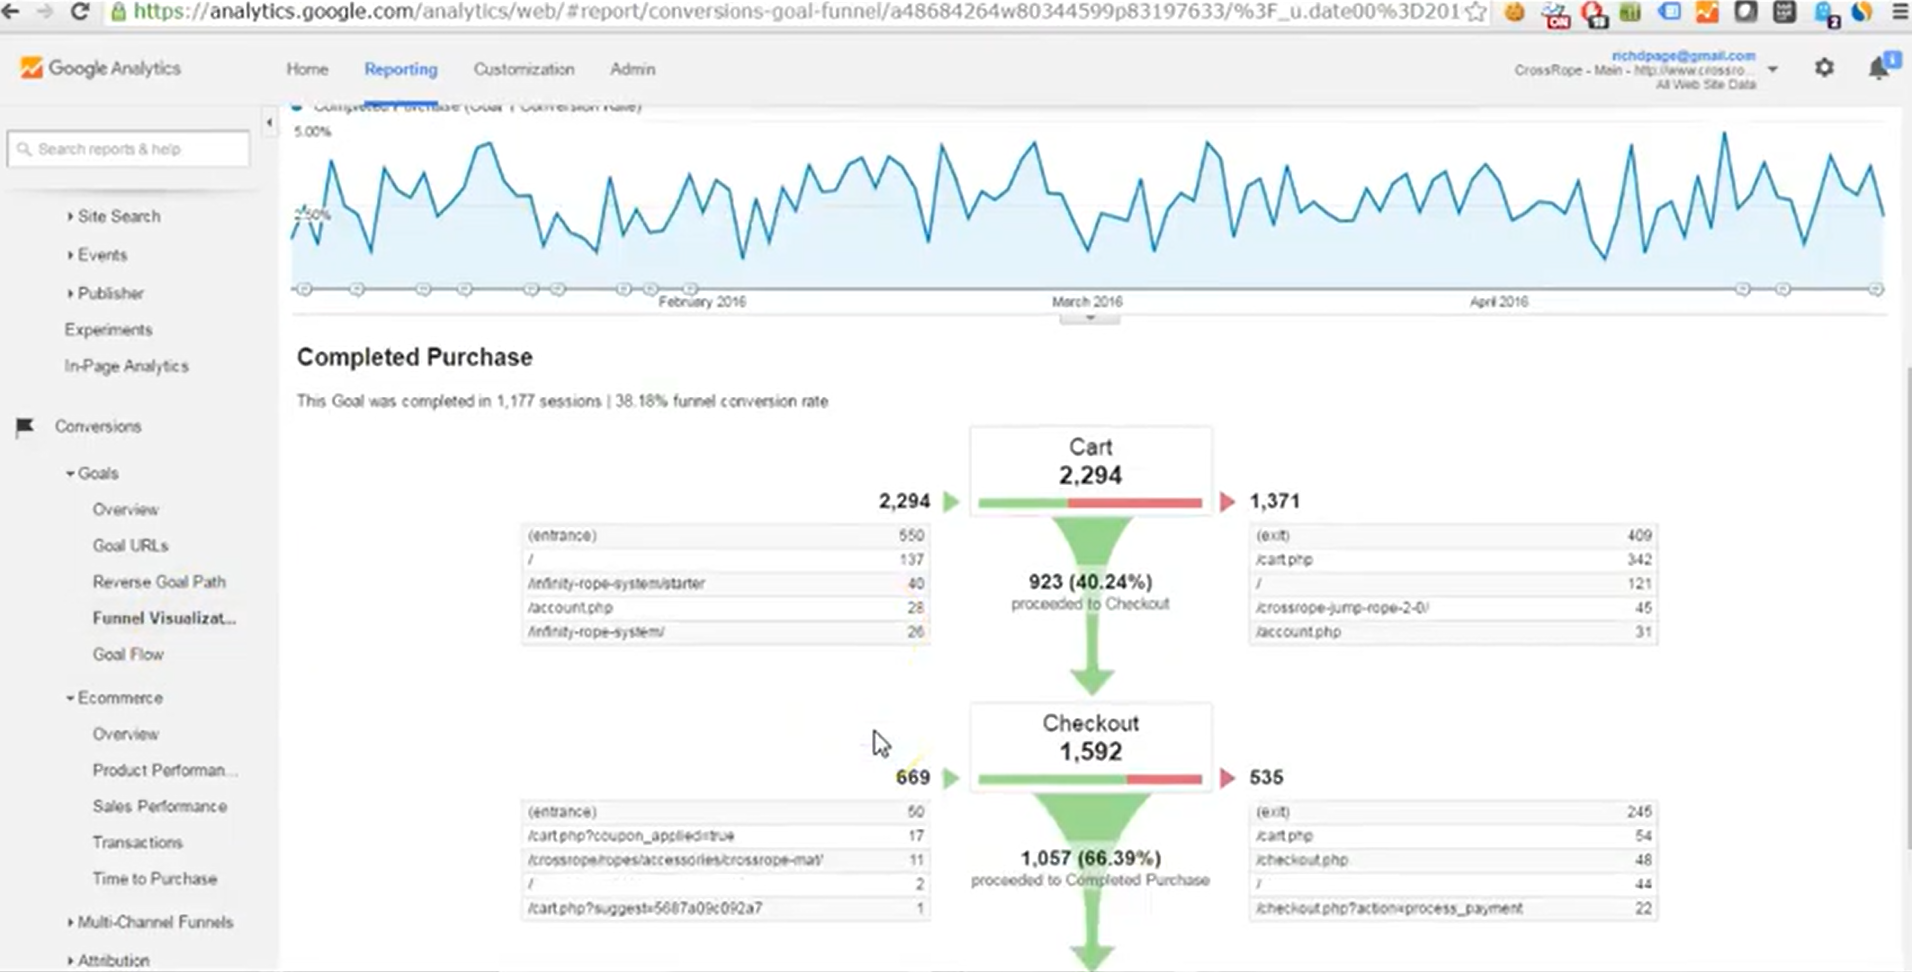
Cart Abandonment Rate
The cart abandonment rate is the percentage of users who add products to their shopping cart but then depart the website without making a purchase. It is an important measure for store managers since it identifies potential hurdles or faults in the checkout process or overall user experience.
You can read more about the top reasons for cart abandonment here.
Customer Acquisition Cost (CAC)
The CAC calculates the cost of acquiring a new customer. Store owners need to understand the cost-effectiveness of their marketing and advertising strategies.
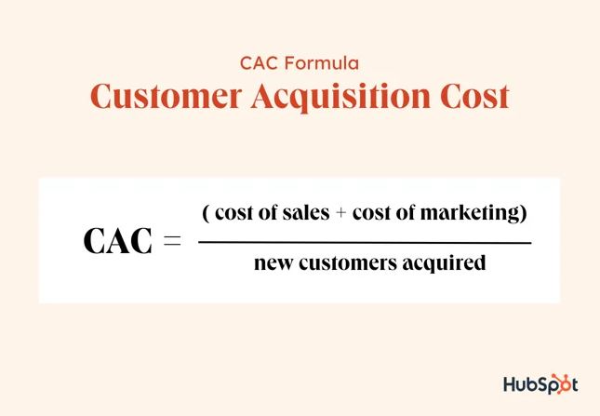
By measuring CAC, store owners can evaluate the impact of their client acquisition efforts, properly allocate resources, and optimize their budgets.
Conversion Rate
The percentage of website visitors performing a desired action, such as making a purchase or filling out a form, is the conversion rate. It is an important indicator for store owners since it shows the efficacy of their website, marketing initiatives, and sales funnel.
The image below from Shopify shows some of the top ways to improve your conversion rate.
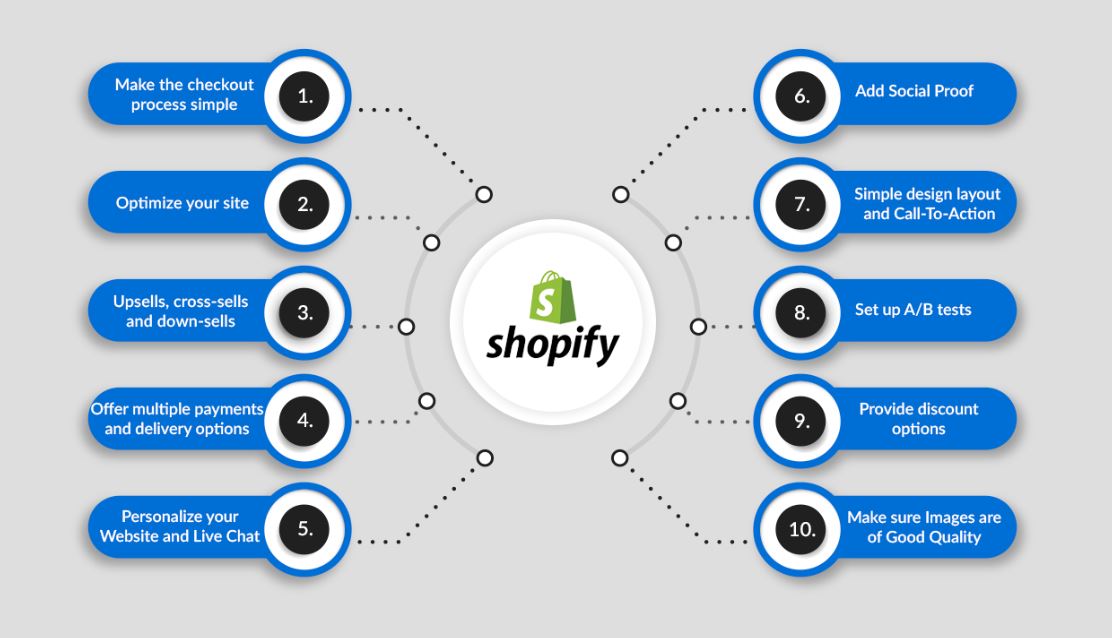
Store owners can increase sales and optimize the return on their marketing spending by maximizing the conversion rate.
Customer Lifetime Value (CLTV)
CLTV indicates the total value a customer delivers to the company throughout their relationship. It is critical for store owners since it allows them to understand their consumer base’s long-term profitability.
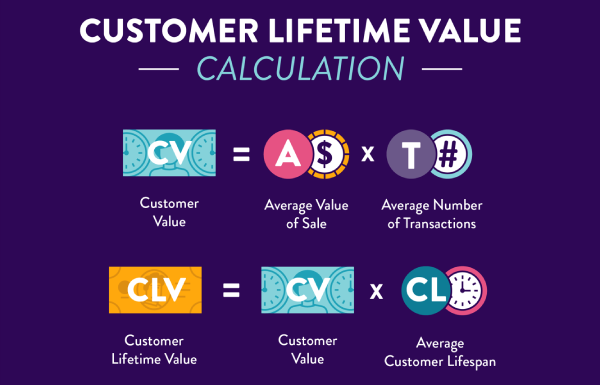
Store owners can arrive at informed judgments about client retention techniques, marketing campaigns, and personalized interaction by calculating CLTV.
Revenue and Sales by Channel
Revenue or sales by channel reveal which sales channels (for example, website, marketplace, or social media) create the most money. This measure is critical for store owners to better manage resources and optimize their omnichannel strategies. Store owners can identify high-performing channels, alter marketing efforts, and focus on the most profitable routes by assessing revenue by channel.
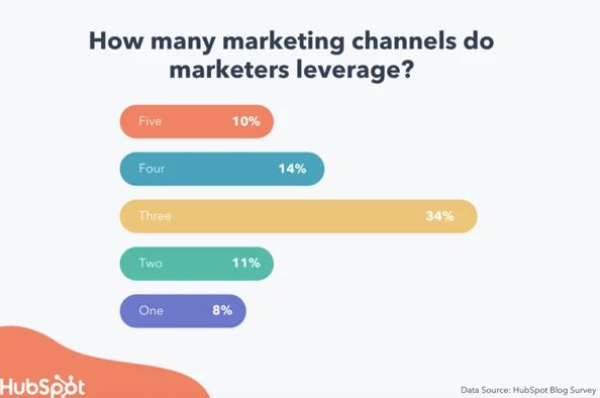
Leveraging just one channel is no longer sufficient in an omnichannel ecosystem. The HubSpot research above shows that in 2022, marketers typically used three or more channels to advertise their stores.
Understanding the proper channels for your business is critical and will vary by industry and customer demographic.
Return on Investment (ROI)
ROI compares the profitability of an investment to its cost. Monitoring ROI assists store managers in determining the efficiency of marketing efforts, advertising spending, and other expenses. It enables store owners to make informed resource allocation decisions, optimize marketing methods, and assure a positive return on investment.
Ways to improve the ROI of your online store include personalization, mobile optimization, up-selling and cross-selling, retargeting, and using data analytics.
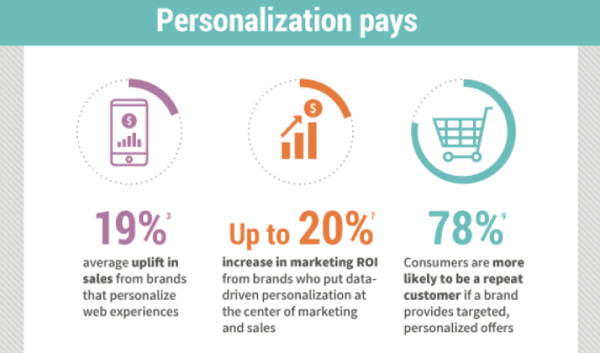
Utilizing customer data and preferences enables personalized product suggestions, boosting conversion rates and sales by offering relevant items. Targeted marketing campaigns based on client segments enhance consumer engagement and click-through rates.
Furthermore, identifying cross-selling opportunities, like suggesting complementary products at checkout, helps optimize average order value and maximize income.
Average Order Value (AOV)
The average amount spent by clients in a single order is represented by AOV. It is critical for store owners since it has a direct impact on revenue and profitability. Store owners can enhance sales and optimize the value gained from every customer by boosting the average order value. Upselling, cross-selling, and offering incentives can all help to raise AOV.
![]()
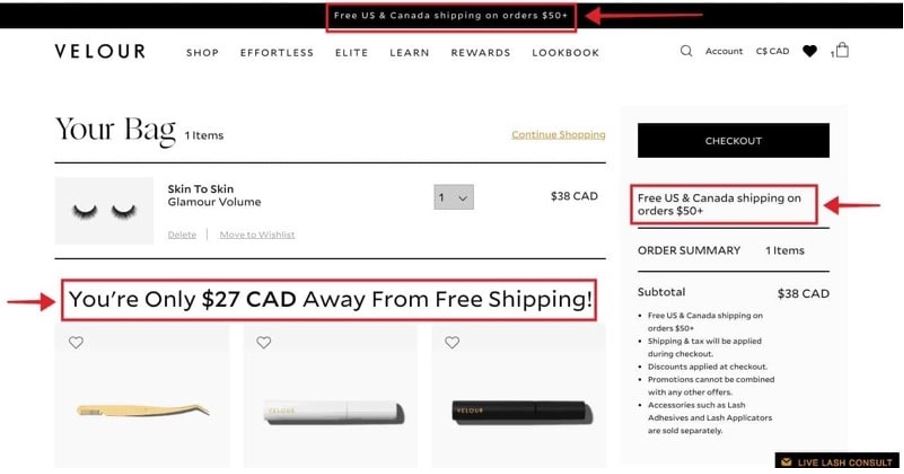
Stores should test different tactics to understand what works best for their customer base.
Customer Retention Rate
The percentage of consumers that continue to make repeat purchases from a store over a given period is the customer retention rate. It is an important indicator for store owners since it demonstrates customer loyalty as well as the efficiency of their customer retention initiatives.
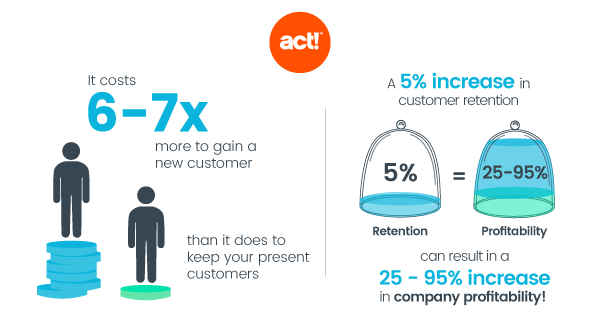
Retaining a new customer cost six or seven times more than retaining an existing one. Furthermore, a slight increase in retention rate can result in up to a 95% increase in store profitability.
Key eCommerce Reports to Monitor
There are several different types of eCommerce reports to help store owners monitor the metrics laid out above. We will briefly look at some of these in the section below.
-
Financial Reports
In eCommerce, financial reports provide a snapshot of the store’s financial performance, including sales, expenses, profit margins, and cash flow. Store owners can use these reports to track sales trends, examine product profitability, evaluate the success of pricing schemes, and make sound financial decisions.
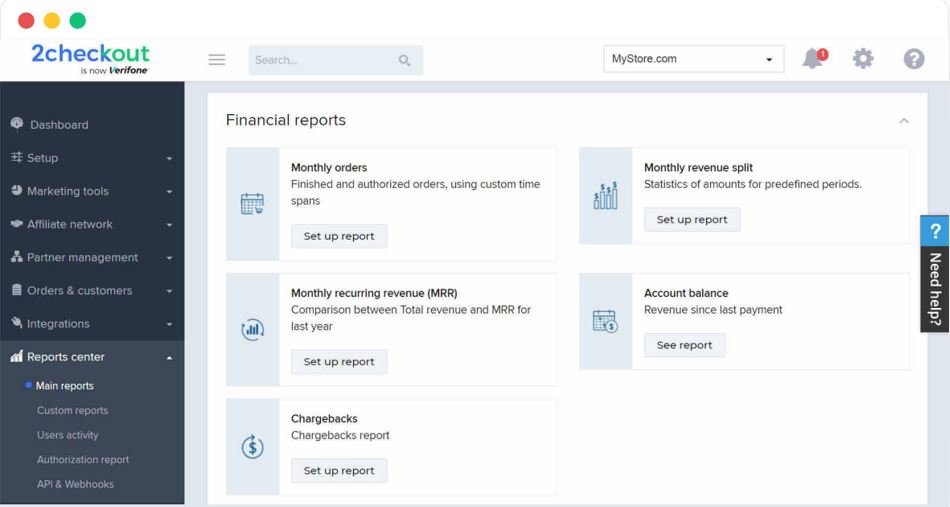
Financial reports aid in assessing the organization’s financial health, identifying cost-cutting opportunities, and establishing financial goals for future growth.
-
Marketing reports
Marketing reports are used to assess the efficacy of various marketing campaigns and activities. They provide information about crucial parameters like conversion rates, customer acquisition costs, return on investment (ROI), and campaign performance across various marketing channels.
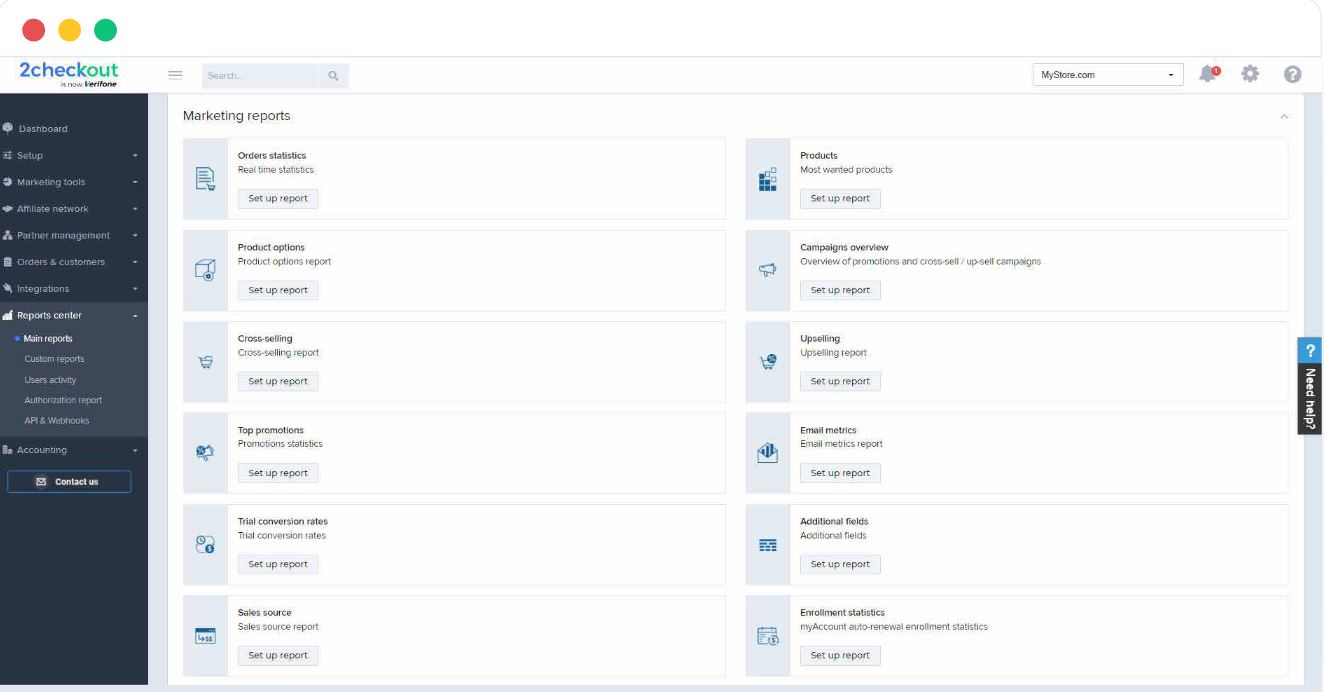
Analyzing marketing reports allows store managers to identify successful marketing approaches, allocate resources, optimize marketing strategies, and enhance targeting to drive consumer engagement and increase sales.
-
Subscription Reports
Subscription reports help eCommerce stores that sell subscription-based items or services. These reports show parameters, including subscriber growth, churn rate, average revenue per user (ARPU), and subscription renewal rates.
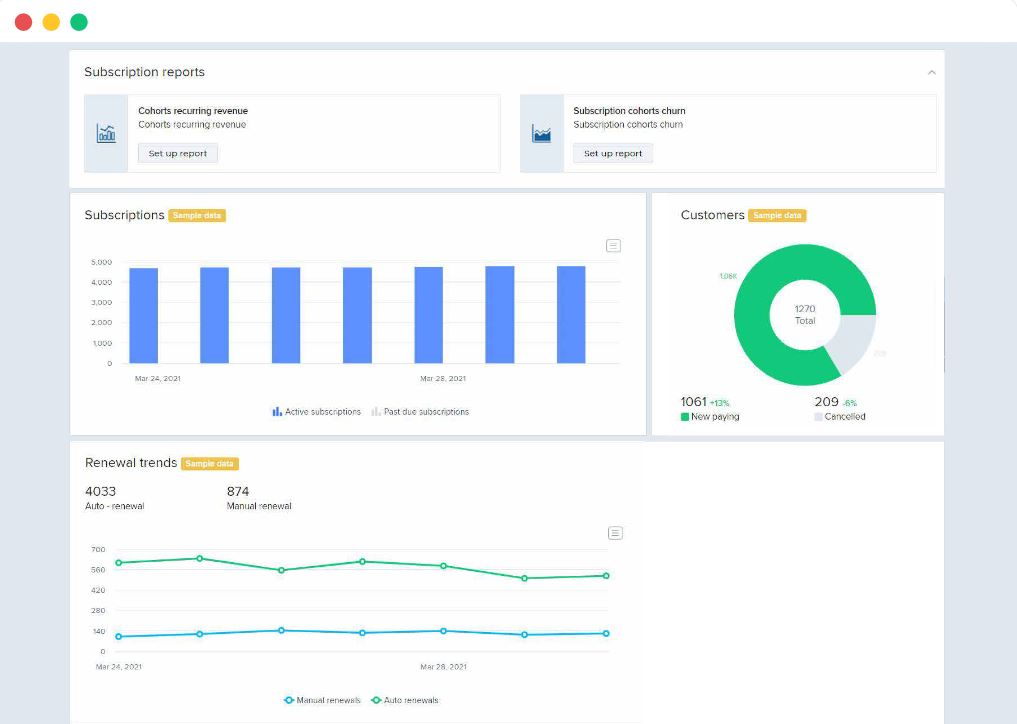
Store owners can assess the performance of their subscription business, find opportunities to reduce churn, optimize pricing and plans, and improve the entire subscriber experience by observing the data.
-
Traffic and engagement reports
Reports on website visitor behavior and engagement indicators are the focus of traffic and engagement reports. Metrics such as website traffic volume, source of traffic, bounce rates, duration on site, and page views per visit are tracked in these reports.
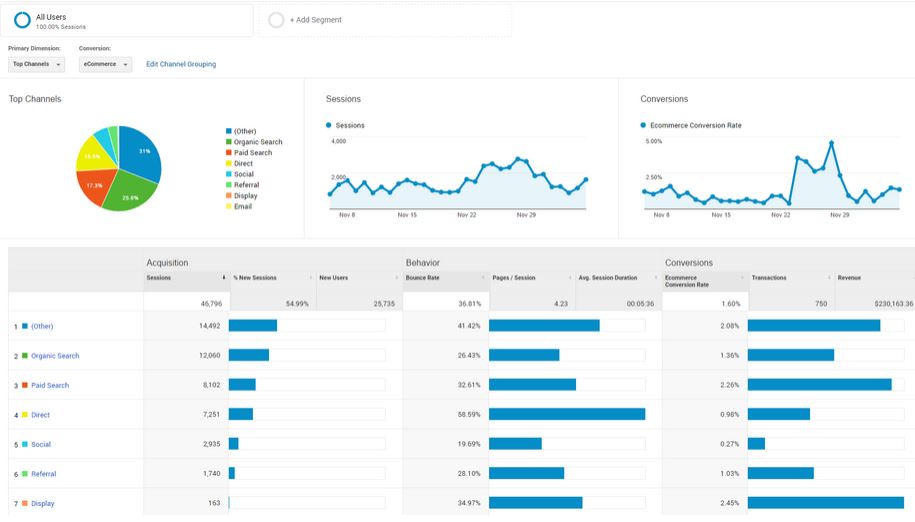
Store owners can acquire insights into customer engagement levels, find popular sites or goods, optimize user experience, and fine-tune marketing efforts by evaluating these statistics.
-
Leads and Sales Reports
Leads and sales reports give you a complete breakdown of your customer acquisition and sales success. Metrics such as lead conversion rates, lead sources, customer demographics, sales revenue, and order quantities are included in these reports.
By reviewing analytics, store owners gain insights into top-performing products, sales trends, and customer preferences, enabling them to optimize their sales funnel for increased conversions and income. These reports facilitate data-driven decisions and the ongoing enhancement of eCommerce operations, fostering long-term success.
Start understanding your eCommerce metrics today.
Store owners can gain significant insights into their data and unlock the full potential of their eCommerce business by investing in the correct technologies. Here’s a quick rundown of how store owners can start understanding their online business metrics right away:
- Determine which metrics correspond to your company’s objectives. Monitor KPIs like website traffic, conversion rates, client acquisition cost, average order value, and customer retention rate.
- Invest in a comprehensive platform that meets your requirements. Look for configurable dashboards, real-time reporting, and the ability to track and analyze multiple metrics.
- Ensure the analytics solution works with your eCommerce platforms, such as Shopify, WooCommerce, or Magento. The integration enables reliable tracking of sales, customer data, and other parameters for your eCommerce store.
- Use website tracking codes and tags to capture data accurately. Technologies such as Google Analytics provide detailed information about website traffic, user behavior, and conversions.
- Invest in data visualization technologies that translate complex data into easily understood visual representations like charts and graphs.
- A/B testing tools allow you to test different website layouts, marketing tactics, and messaging to see which produces the best results. These technologies provide insights into user behavior and help with conversion rate optimization.
- Include customer feedback methods such as questionnaires, reviews, and social media monitoring. Understanding consumer emotions and preferences can help refine tactics and enhance the customer experience.
Store owners can access thorough data analysis, obtain actionable insights, and make data-driven decisions to maximize their eCommerce business by investing in the right technologies. Remember that the key is to choose solutions aligned with your company’s needs, integrate effortlessly with your eCommerce platform, and have a user-friendly interface for successful data interpretation.