Staying on top of the software, SaaS and online services industry and purchase trends is absolutely vital if you want to sell your digital products and services online at a global level.
If you are not up to date with the top countries for software sales, most popular payment methods at country level, average order value and most attractive types of products in each market, among other information, your go-to-market strategy will not provide the correct framework and most probably you won’t be able to reach your targets.
To help you keep up with essential market knowledge, we regularly compile the Digital Commerce Benchmark report covering trends in global software, SaaS and online services sales.
Also: Looking to expand your business in new regions? Check out this free Whitepaper on Global Commerce in Local Markets for Software and SaaS Companies.
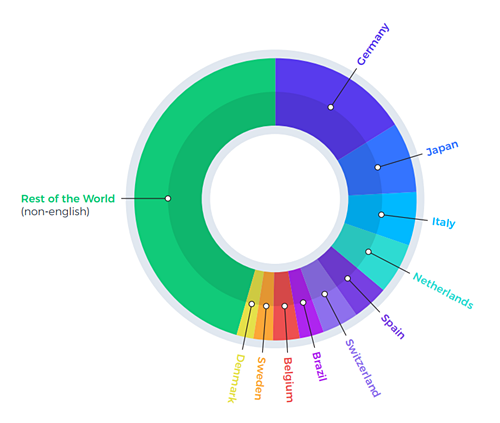
Well, it’s no surprise that the United States remains the leader in global software sales:
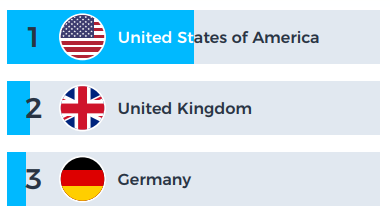
At the same time, it’s interesting to see that the top 10 non-English speaking countries make over 30% of the total global software and online services market. 30% is a big chunk that you don’t want to ignore, but you also need to take into account the go-to-market effort required by a highly-fragmented market, with localization requirements.
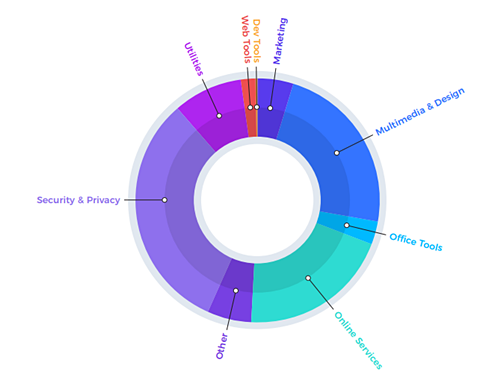
In the first half of 2017, security and privacy software led the way in sales, again not surprising, with 2017 marked by cybersecurity breaches – WannaCry, Goldeneye, Equifax. The multimedia and design software category (including audio-visual tools) follows at 23 percent, and online services come in strong at 20 percent. Other categories tracked in the report include utilities, marketing tools, web tools, office and dev tools.
Another interesting point is that subscription-based business models continue to gain ground, accounting for 75% of sales in H1 2017 compared with just 49% in 2012. This explains also why the global average order value (AOV) for these digital products and services decreased this year at $47, a small drop from $48 in 2016,
On how people pay for software, we also have some interesting findings. Visa and MasterCard continue to dominate in terms of payment methods at global level (and in the US), accounting for 68 percent of global online sales. However, it’s interesting to see how Preferred payment methods can vary widely by country, with PayPal leading in Germany, Alipay dominating the Chinese market and iDEAL coming out ahead in the Netherlands.
Armed with this information, you can focus your online sales efforts on the regions and countries that matter most to you—and offer customers the option to pay with their preferred payment methods.
For more insightful highlights from the report, including the most impactful sources of additional revenue for online software sales, see the full infographic: