As you’ve gotten accustomed to in the past few years, here we are sharing our annual digital commerce benchmark.
This report is based on our analysis of millions of transactions made around the world on the 2Checkout platform. The most recent benchmark, for H1 2020, uncovers how global commerce of digital goods and services evolved in the first half of the year, and – due to the extraordinary times that we live in – it also looks at how the pandemic influenced online sales in key markets.
Overall Top Standings
To start with, the top-10 countries list was pretty consistent with last year’s rankings and accounted for 78% of all global online sales. What is interesting to note is the growth in digital goods sales for these countries – attributed to some (large!) extent to the COVID-19 pandemic.
While the US was again the number one country in terms of online transactions, with almost 48% of all sales, it registered just a 20% year-over-year increase, the smallest among top 10 countries.
The list also features the UK, France, Canada, Germany, Australia, Italy, Japan, Spain and the Netherlands. Of these, Italy and Spain, the two established economies that went into lockdown at the start of the year, registered the highest year-over-year growth of online sales of digital goods and services, at 50% and 48%, respectively.
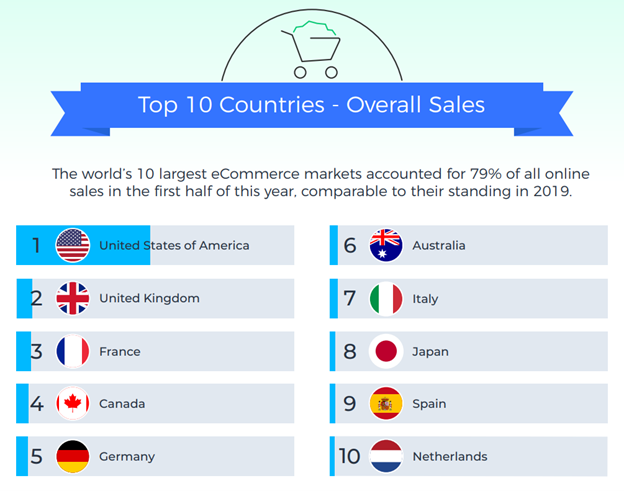
The top 10 non-English-speaking countries generated 22% of all digital commerce sales, a 2% increase from 2019, with France as number one. The other nine top countries in this category were, in order, Germany, Italy, Japan, Spain, the Netherlands, Switzerland, Brazil, Belgium, and China.
Payment Method Preferences
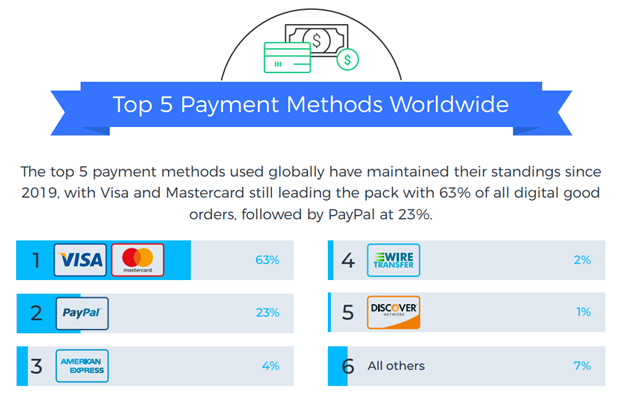
As for the top 5 payment methods worldwide, Visa and MasterCard continue to be the most popular payment methods globally among 2Checkout transactions, dominating online sales at 63% share. PayPal came next in line, accounting for 23% of all online payments for digital goods in the first half of 2020, followed by American Express at 4%.
Local payment means gained traction in many online markets, as shoppers favored these for online purchases of digital goods and services. Netherlands is a great example of a country for which neither Visa nor Mastercard are the first choice in payments; Dutch residents favored iDeal, a local payment option utilized in more than half of their online transactions. Alipay dominated in China with 62% of all transactions, Boleto Bancario in Brazil accounted for 30%, whereas in France 23% of all online orders of digital goods were paid via Carte Bancaire.
Key Trends in 2020
Subscription sales on the rise
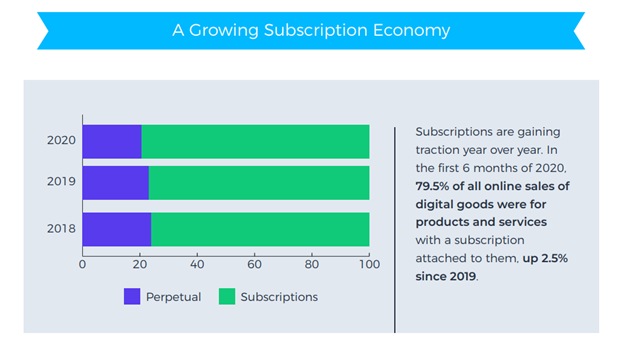
In the first six months of 2020, 79.5% of all online sales of digital goods were for subscription-based purchases. This shows a steady increase over the last two years, subscriptions registering 77% of all online sales of digital goods in 2019 and 76% in 2018.
Popular digital products
In all of the top 10 countries for the first six months of 2020, endpoint security, multimedia tools, and video editing software were among the most popular digital goods sold online. Services in general were the most bought categories in the US, with financial services ranking number one in this market.
Other popular digital goods and services bought online included educational services in Canada and TV streaming in Australia.
Additional revenue sources
Affiliate marketing continues to be an important revenue source for the software industry, accounting for 24% of online sales for merchants using 2Checkout’s award-winning Avangate Affiliate Network.
Promotional tools also proved efficient and increased revenue when used by merchants, generating 36% of the revenue earned in the first half of 2020, an increase of 3% from 2019.
Cross-sell and upsell tactics are also proving to be effective, drawing in 15% of all revenue for merchants who used them in online sales campaigns.
After a tumultuous six months, marked by uncertainty and dramatic user and business adjustments to pandemic life, that is what’s new in the digital commerce benchmark. COVID-19 has undeniably influenced the landscape of eCommerce, although it’s too soon to understand when post-pandemic growth is going to stabilize. 2Checkout will continue to monitor shifts and trends in online commerce, helping you with actionable insights and recommendations on how to scale your eCommerce business around the world.
To see all of the results from our Digital Commerce Benchmark H1 2020 report, check out our summary infographic here.