
You’ve successfully executed your A/B tests, meticulously analyzed the data, and made strategic decisions based on the results. However, a puzzling situation emerges as the outcomes observed in those sophisticated A/B testing tools fail to align with real-world observations.
What gives? Welcome to the world of the discrepancy between A/B testing tools and real-life observations. It’s a wild ride where factors like statistical variance, sampling bias, contextual differences, technical glitches, timeframe misalignment, and even regression to the mean can throw off your carefully calculated results.
Buckle up as we dive into the nitty-gritty of why these discrepancies happen and what you can do about them.

Technical Issues
A/B testing tools rely on JavaScript code or other technical implementations to assign users to different variations. However, despite how robust they are, these tools are not immune to technical issues that can impact the accuracy of their results. For instance, script errors within the implementation can occur, preventing proper tracking of user interactions or leading to faulty assignment of users to variations. These errors can disrupt the data collection process and introduce inconsistencies in the results obtained. Additionally, compatibility issues with different web browsers or variations in caching mechanisms can affect the tool’s functionality, potentially leading to discrepancies between the observed results and the actual user experience.
Moreover, the impact of technical issues can vary depending on the complexity of the website or application being tested. Websites featuring complex user pathways or dynamic content are particularly prone to technical challenges that can disrupt the A/B testing process. The presence of third-party scripts or integrations can further complicate matters, as conflicts or errors in these components can interfere with the accurate tracking of user behavior. These technical complexities emphasize the importance of thorough testing and quality assurance to ensure the proper functioning of A/B testing tools and minimize the potential for discrepancies between the tools’ results and the actual performance of the variations in real-world scenarios.
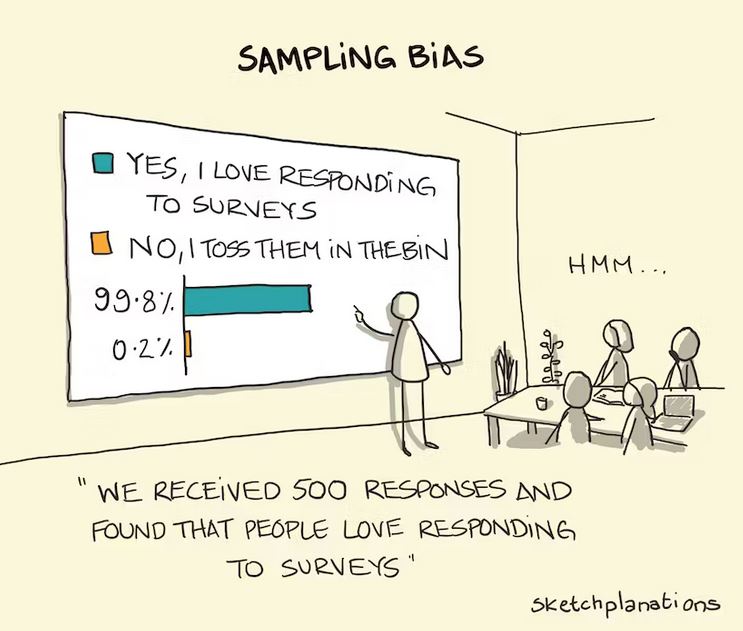
Sampling Bias
A/B testing tools often allocate users to different variations randomly. However, due to the random nature of the assignment, there can be instances where certain user segments are disproportionately represented in one variation compared to another. This can introduce bias and impact the results observed in the tool. For example, if a particular variation is shown more frequently to users who are already inclined to make a purchase, it may artificially inflate the conversion rate for that variation.
Similarly, if a certain user segment is underrepresented in a variation, the tool may not capture their behavior adequately, leading to inaccurate conclusions about the variation’s effectiveness. This sampling bias can create a discrepancy between the results obtained from AB testing tools and the actual behavior of the broader user base.
Timeframe Misalignment
A/B testing tools typically accumulate data over a specified period to analyze the results. However, the timing of data collection in relation to the live performance of the variation can introduce discrepancies. One common issue is when the tool collects data for a longer duration than the period when the variation was actually live. In such cases, the tool may inadvertently include additional time periods where the variation’s performance differed from the intended version, thus skewing the overall analysis. This can lead to misleading conclusions and a disconnect between the tool’s results and the actual impact of the variation during its intended timeframe.
Conversely, there can also be instances where the data collection period of the A/B testing tool falls short of capturing the full effect of the variation. If the tool’s timeframe is shorter than the period it takes for users to fully engage with and respond to the variation, the results may not accurately reflect true performance. This can occur when the variation requires a longer adaptation period for users to adjust their behavior or when the impact of the variation unfolds gradually over time. In such cases, the tool may prematurely draw conclusions about the effectiveness of the variation, leading to a discrepancy between the tool’s findings and the actual long-term performance in real-world conditions.
To mitigate the impact of timeframe misalignment, it is crucial to carefully plan and synchronize the data collection period of A/B testing tools with the live deployment of variations. This involves aligning the start and end dates of the testing phase with the actual timeframe when the variations are active. Additionally, considering the potential lag time for users to adapt and respond to the changes can provide a more comprehensive understanding of the variation’s true impact. By ensuring a proper alignment of timeframes, businesses can reduce the risk of discrepancies and make more accurate data-driven decisions based on the results obtained from A/B testing.
Contextual Difference
A/B testing tools often operate within a controlled testing environment, where users are unaware of the test and might behave differently compared to when the variation is set live in the real world. One important factor contributing to the discrepancy between testing tool results and live performance is the novelty effect. When users encounter a new variation in a testing environment, they may exhibit heightened curiosity or engagement simply because it is different from what they are accustomed to. This can artificially inflate the performance metrics recorded by the testing tool, as users may interact with the variation more enthusiastically than they would in their regular browsing or purchasing habits.
Additionally, the awareness of being part of an experiment can influence user behavior. When users are aware that they are part of a testing process, they may exhibit conscious or subconscious biases that can affect their responses. This phenomenon, known as the Hawthorne effect, refers to the alteration of behavior due to the awareness of being observed or tested. Users might become more attentive, self-conscious, or inclined to behave in ways they perceive as desirable, potentially distorting the results obtained from the testing tool. This discrepancy between the controlled testing environment and the real world can lead to differences in user engagement and conversion rates when the variation is implemented outside the testing environment. A person with a keen eye can typically notice the subtle cues determine that they are entering an A/B test.
Moreover, the absence of real-world context in the testing environment can also impact user behavior and subsequently influence the results. In the real world, users encounter variations within the context of their daily lives, which includes a wide range of external factors such as time constraints, competing distractions, or personal circumstances. These contextual elements can significantly influence user decision-making and actions. However, A/B testing tools often isolate users from these real-world influences, focusing solely on the variation itself. As a result, the tool’s results may not accurately capture how users would respond to the variation when confronted with the complexity of their everyday experiences. This discrepancy in contextual factors can lead to differences in user behavior and outcomes between the testing tool and the live performance of the variation.
Regression to the mean
In A/B testing, it is not uncommon to observe extreme results for a variation during the testing phase. This can happen due to random chance, a specific segment of users being more responsive to the variation, or other factors that may not hold true when the variation is exposed to a larger, more diverse audience over an extended period. This phenomenon is known as regression to the mean.
Regression to the mean occurs when extreme or outlier results observed during testing are not sustainable in the long run. For example, if a variation shows a significant increase in conversion rates during the testing phase, it is possible that this spike was due to a specific group of users who were particularly receptive to the changes. However, when the variation is set live and exposed to a larger and more diverse audience, it is likely that the initial spike will diminish, and the performance will converge towards the average or baseline level. This can lead to different results compared to what the testing tool initially indicated, as the extreme outcomes observed during testing may not be indicative of the variation’s long-term impact.
Understanding the concept of regression to the mean is essential when interpreting A/B testing results. It highlights the importance of not solely relying on the initial testing phase findings but considering the overall performance of the variation over a more extended period. By considering the potential for regression to the mean, businesses can avoid making erroneous conclusions or implementing changes based on temporary spikes or dips observed during the testing phase. It underscores the need for cautious interpretation of A/B testing results and taking a comprehensive view of the variation’s performance in the real world.
Conclusion
So, there you have it. The reality of A/B testing tools doesn’t always align with the real-world outcomes you experience. It’s not a flaw in your analysis skills or a sign that A/B testing is unreliable. It’s just the nature of the beast.
When interpreting A/B testing results, it’s crucial not to solely rely on the initial findings but consider the overall performance of the variation over an extended period. By doing so, businesses can avoid making erroneous conclusions or implementing changes based on temporary spikes or dips observed during the testing phase.
To navigate the reality gap, it’s important to approach A/B testing results with a critical eye. Be aware of the limitations of the tools and account for real-world contexts. Supplement your findings with other research methods to gain a comprehensive understanding of the variation’s performance. By taking a holistic approach, you’ll be well-equipped to make data-driven decisions that align with the reality of your users.