
As we do each year, we recently shared our benchmark report, a comprehensive analysis of global eCommerce sales of software, digital goods, and services for the past year. Our Digital Commerce Benchmark 2020 summarizes the latest developments in digital commerce passing through the 2Checkout platform and should help guide your online business sales strategies for the year ahead.
We saw significant shifts in the industry landscape due to the COVID-19 pandemic, which took the world by surprise and drove much of brick-and-mortar retail to lean their course toward a digital commerce model. With 2020 now in the rear mirror, let’s take a look at our how global commerce of digital goods and services has evolved during this unprecedented period.
A Look at the Top Standings
The Top 10 Countries in Overall Sales of software, SaaS, and online services that previously dominated eCommerce in 2019 continued their reign in 2020, accounting for 77% of all online sales, although in a slightly different order. The US led overwhelmingly with 46% of sales worldwide, and the UK ranked second again, at almost 6%. Germany, at 5%, replaced France for third highest online sales in the 2020 rankings, with France in fourth.
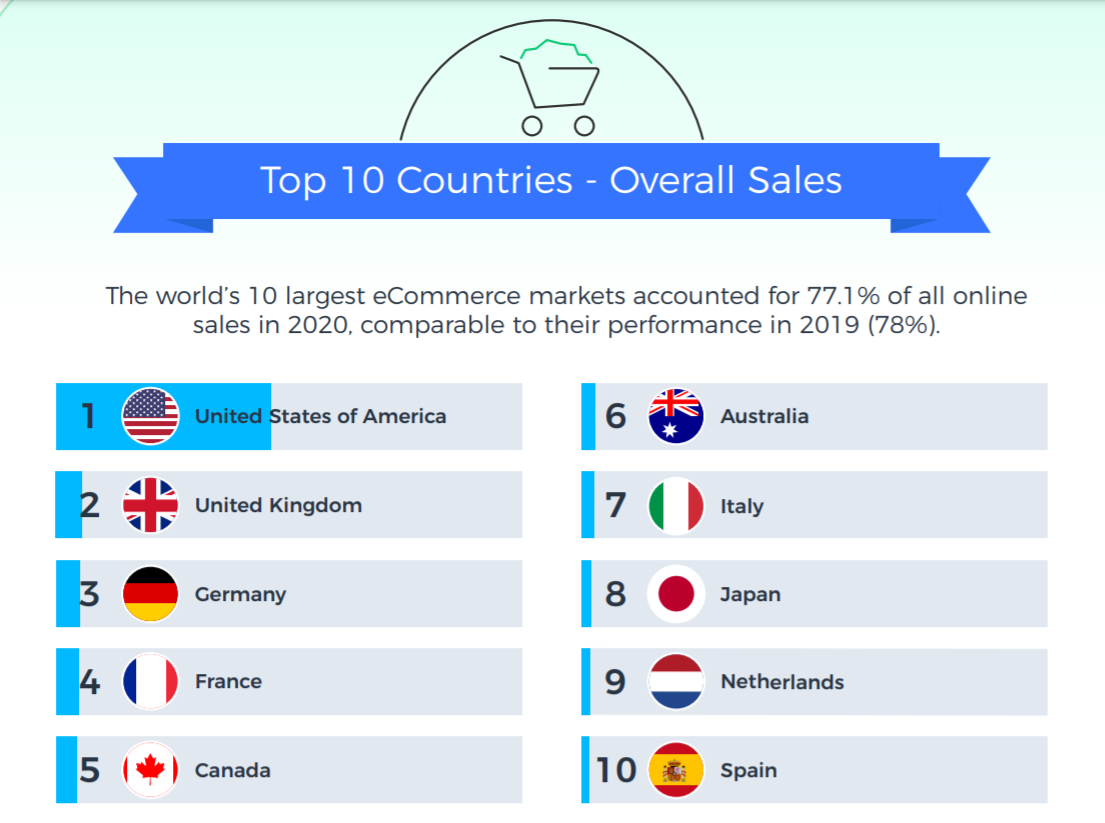
The Top Ten Non-English-Speaking Countries accounted for 21% of total global software sales (a small increase of 1% over 2019) with Germany topping that list at 5% of sales and France close behind at 4.9%.
The Year-over-Year Growth of the Top Ten Countries was emphatic: digital sales in 2020 accelerated dramatically due to COVID lockdowns and the corresponding move to digital commerce among their consumers. Japan showed the highest year-over-year growth, with a 40% increase, followed by the UK at 34% and Australia at 32%.
The Top Payment Methods Worldwide remained constant since 2019, with Visa and Mastercard continuing as the most popular with 63% of all digital goods orders, and PayPal following at 21%. Several countries continued to favor local and regional payment methods, with Alipay in China at 62% in 2020, iDEAL in the Netherlands at 56%, the Boleto in Brazil coming in at 32%, and Carte Bancaire in France at 23%. eWallets, direct debit, and payment in installments continue to boast preference in some select regions around the world.
Pandemic Impacts Average Order Value and Subscription Sales
An interesting and quite significant development was the increase of the average order value in 2020 to $65, a $9 increase versus 2019 and likely generated by the strong transition to online shopping brought by the COVID-19 pandemic. Mobile orders also registered an increase, sitting at $51 in 2020, up $1 since 2019.
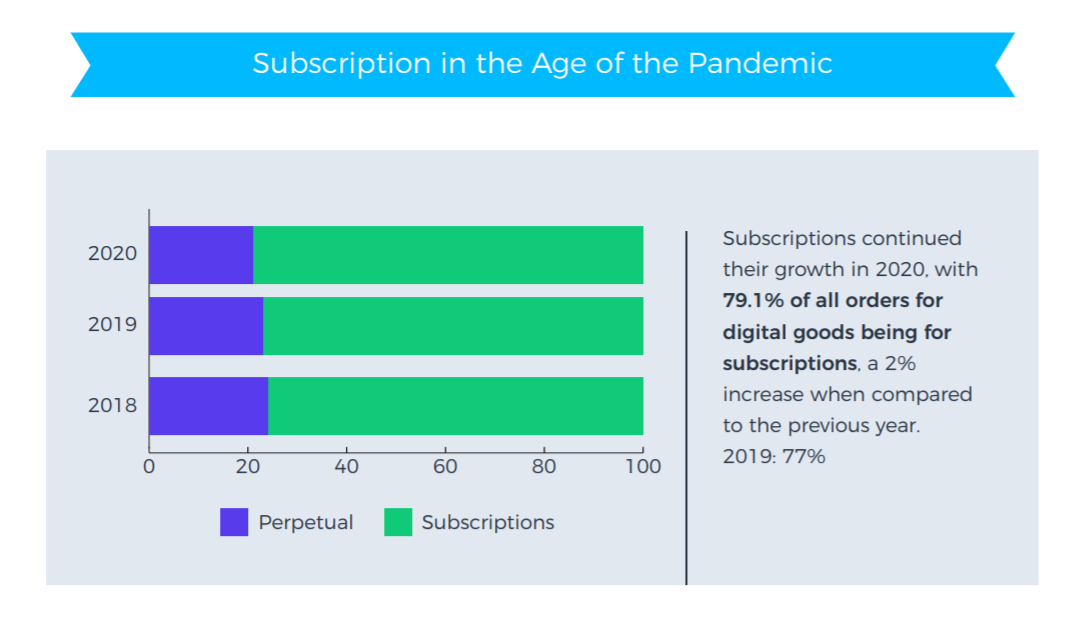
Another area of growth was subscription sales, which also grew during 2020 with 79% of total online sales of software and digital goods in 2020 coming from subscription-based products and services, up 2 percentage points since 2019.
Popular digital product purchases revealed by benchmark
- Endpoint security software still surges in popularity and continued to be among the favorite online purchases in the digital goods category in 2020. This was perhaps due to the increase in cyber-fraud and online attacks corresponding directly to the enormous increase of online purchases; consumers and businesses both have a growing knowledge and understanding of the need for security solutions.
- Multimedia tools, software utilities, marketing, streaming, and financial tools also showed growing popularity.
Additional benchmark highlights
- Additional revenue sources remained strong options during 2020. Affiliate-generated sales as an additional marketing channel for the software industry were strong for 2Checkout clients. Software merchants using the Avangate Affiliate Network in 2020 saw affiliate marketing bring in 24% of their total revenue, up 1% since 2019.
- Promotional tools generated 36% of 2020 revenue for merchants, an increase of 3% from last year, with November as the month with the highest promo sales as the traditional Black Friday and Cyber Monday promotions were undeterred (and perhaps enhanced) by COVID-19 restrictions.
Conclusion
As the world moved to working, studying, and shopping remotely and online almost exclusively during the 2020 pandemic, it’s understandable that online sales of digital goods saw a tremendous boost. Our benchmark showed that this growth resulted not just in a dramatically increased Average Order Value but also in overall escalation in sales. Subscription sales saw a surge in adoption by both consumers and businesses alike for their convenience and buyers’ growing need for services offered as subscriptions.
It’s undeniable that COVID-19 was a strong influence on the landscape of eCommerce during 2020, and it will be interesting to see which market variabilities stick, how brick-and-mortar will (or will not) bounce back, and what’s ahead in eCommerce sales around the world.
For more insights and to see the complete results of the benchmark, please visit our infographic.