
Conversion rate optimization (CRO) might sound like marketing jargon, but at its core, it’s about one thing: turning browsers into buyers. Our 2024 CRO Benchmarks for H1 overwhelmingly indicate that it can help businesses, from startups to global enterprises, improve their checkout experiences and ultimately drive revenue.
In an increasingly competitive digital marketplace, even minor tweaks to the user experience can lead to significant revenue gains. Whether you’re running a B2B SaaS company, a global eCommerce platform, or a digital goods vendor, these insights are invaluable.
This report is particularly relevant as it shines a light on trends across regions, industries, and device types. Understanding these subtle (and sometimes not-so-subtle) differences can help businesses tailor their strategies effectively. Let’s dive deep into what the latest benchmarks reveal.
The Power of a Percentage: Where Are We Now?
Our data concludes that the average checkout conversion rate across top platforms hit 28% in the first half of 2024. This figure reflects the success of companies that are actively optimizing their checkout experiences and highlights the potential for growth in underperforming businesses. But it’s not all about averages—context matters:
- B2C sales hover around a solid 29%, slightly outperforming B2B sales at 27%. The difference makes sense: B2C purchases are often impulsive and emotionally driven, while B2B transactions tend to be more rational.
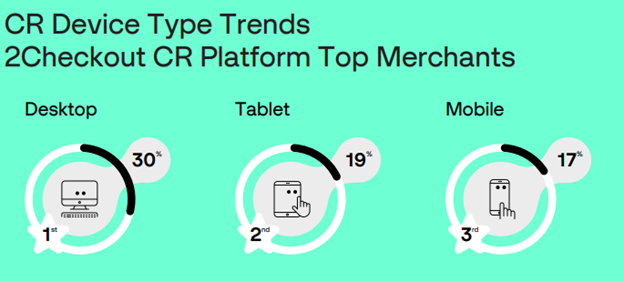
- Device types also play a significant role in shaping conversion rates. Our numbers highlight that desktops dominate with a 30% conversion rate, followed by tablets at 19%, and mobile devices trailing at 17%.
Geography Matters: Where Do Conversions Soar?
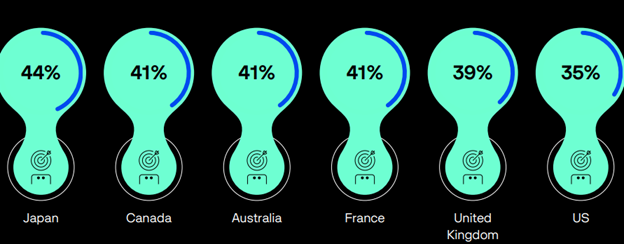
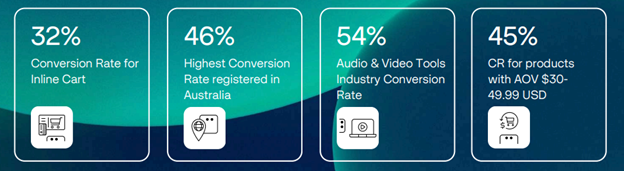
Countries like Japan, Canada, Australia, France, the UK, and the US are leading the way with conversion rates surpassing 40%. This success can be attributed to several factors:
- High levels of digital literacy and internet penetration
- A mature online payments infrastructure
- Consumer trust in online transactions
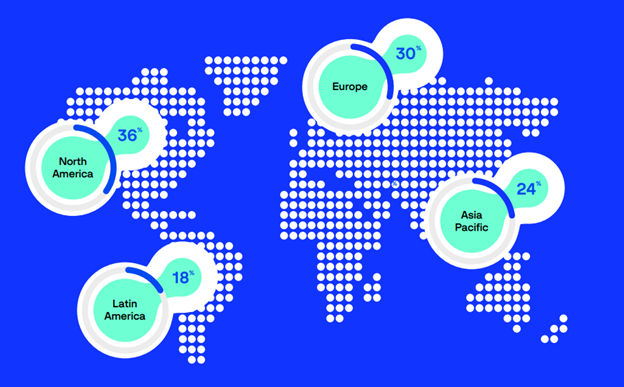
In contrast, regions like APAC (Asia-Pacific) are experiencing impressive growth despite trailing slightly in average conversion rates. For instance, Japan and South Korea reported year-over-year conversion rate increases of 5-10 percentage points, highlighting the rapidly evolving digital landscape in these markets.
The data also points to notable gains in Latin America (LATAM), where emerging markets are beginning to close the gap with more mature economies.
For global businesses, this presents a significant opportunity to expand into new markets while tailoring their approaches based on regional behaviors. In 2025, localization is the name of the game, and product managers have to think about whether their existing offerings are feasible in new regions or not.
Industry-Specific Insights: Who’s Winning the CRO Game?
CRO performance isn’t uniform across industries. Different sectors come with unique challenges and opportunities, reflecting the complexity of their customer journeys and purchasing processes.
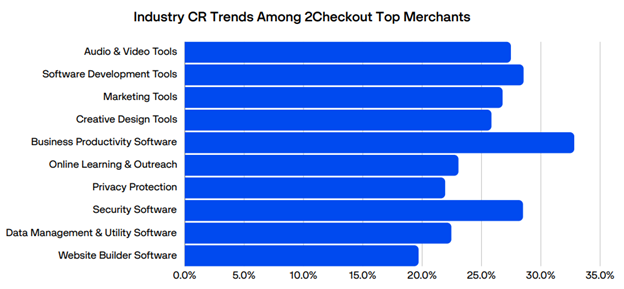
- Business productivity software and security software consistently enjoy higher conversion rates. The reason? Businesses view these tools as essential investments, leading to more predictable purchasing behavior.
- Web tools and creative design tools, on the other hand, face a tougher landscape. These sectors often target freelancers and small businesses, which tend to be more price-sensitive.
A particularly fascinating insight involves the comparison between two software delivery models:
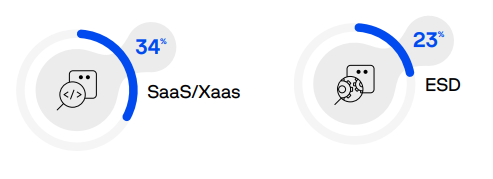
- SaaS/XaaS (Software-as-a-Service/Everything-as-a-Service): Our data indicates that subscription-based offerings boast a 9% higher conversion rate than traditional software delivery models. Their appeal lies in flexibility, ease of use, and predictable pricing.
- ESD (Electronic Software Delivery): This model focuses on offering digital downloads, which involve one-time payments.
The Rise of Inline Carts: A Checkout Revolution
In the realm of checkout design, Inline carts are emerging as game-changers. Instead of redirecting users to a separate checkout page, Inline carts display as an overlay on the merchant’s website pages, for example on a product page, or a pricing page. This streamlined flow reduces friction and keeps customers engaged.
Likewise, inline carts are particularly effective for mid-priced products, typically in the $30-$49.99 USD range. At this sweet spot, impulse buys are possible while still being affordable enough to avoid lengthy decision-making processes.
What’s Next for CRO?
The benchmarks underscore the need to constantly evolve your CRO strategy. As digital markets mature and consumer expectations shift, staying competitive means tracking key trends—like the rise of SaaS models, the popularity of Inline carts, and the growing impact of AI, with 56% of businesses partially adopting it and 20% already advanced.
Regional growth is also reshaping the landscape. APAC and LATAM markets are expanding fast, making localized checkout experiences more critical than ever—a key strength of 2Checkout.
Bottom line: optimizing your checkout isn’t just a quick win—it’s a smart, long-term move. Download our 2024 CRO Benchmark to explore insights from our expert analysis of client performance data.