
Why product analytics is important for SaaS companies
If you’ve started gaining momentum with your SaaS product or have been enjoying healthy traction for some time, you’ve likely realized it’s not feasible to look at every user’s activity across your product.
There’s a ton of data to organize and understand – so how do you gather and track it all?
The answer: product analytics.
Product analytics is the best tool for understanding customer behavior and for finding optimization opportunities – tracking metrics at each stage of the customer journey is a good start, but it’s not enough.
Product analytics transforms chaotic user behavior into linear customer path analysis that makes it much easier to drive insights from and find growth opportunities.
Most importantly, it will help you understand how to get your customers to experience the value that your product offers to its full potential. Product analytics will help you know who gets your product’s value, and what stops those that don’t.
Questions product analytics should answer
Here are a handful of examples of questions that successful product analytics will answer for you:
- Acquisition: What acquisition channels are most efficient and we should focus on?
- Activation: What can I do to improve my onboarding?
- Retention: What segments should we focus on to reduce churn?
- Revenue: How can I improve my free trial to paid conversion?
- Referral: What activity patterns are most likely to trigger referrals?
Getting started with product analytics
Tip #1: Before any data is collected, you need to map the customer journey with all of the touchpoints where users interact with your product and business.
Mapping your customer journey metrics is so important because it enables team alignment within your company on what defines each stage of the customer journey, what the requirements are for your customers to benefit from the value of your product, and what that value is. If two different departments use different definitions for any metrics, customers will suffer, because the different departments will optimize for different experiences, and so on for the next customer lifecycle stages.
We’ve all heard the saying: garbage in, garbage out. After working with hundreds of SaaS companies, from startups to high growth and scaling ones, I can fairly say that it’s rare to find companies for which this does not apply. Almost everyone has data quality issues, so you clearly need to have a framework in place to fix it.
To have good quality data, you need to track the right data. Which leads us to tip #2:
Building your data tracking plan
Tip #2: Building a solid data tracking plan will ensure you’re collecting the good quality data you’re looking for. A successful data tracking plan is the key to healthy product analytics.
A data tracking plan (or short, tracking plan) is designed to document your product data. It covers everything you need to track in your product about how people are using it and how they engage with it.
It’s also a collaborative document shared by dev, product, and marketing. This document is where you define how you track data in an organization for analytics purposes or any data-led initiatives.
At a high level, the tracking plan contains information on:
- Events users or accounts perform at each stage of the customer journey pillars – acquisition, activation, etc. event properties that give you the context of the events being tracked.
- User and account identifier elements, such as ids, email addresses, etc.
- User or account properties that enable segmentation.
The events and properties tracked are clearly defined, broken down further into additional dimensions for extra insights, and documented so that the whole team knows what’s being tracked and how.
The tracking plan becomes tracking documentation for the dev teams, as they can work on integrations much more easily (without asking product or marketing too many questions), understand what tool is being used for what purpose when it comes to collecting and processing data, and how to track events and properties, making it very easy for them to deliver an accurate setup.
Most importantly, it ensures that the dev team will not implement without assuming and generate events that have totally different meanings from what the product people believe.
With a data tracking plan you’ll be able to:
- Set the events behind your main metrics;
- Set how the events should be tracked: from your backend, from the interface of your product, or through an integration;
- See the events’ tracking status;
- Set account properties that need to be tracked.
A framework to start analyzing your data
Tip #3: Start with the big picture, and determine what stage of your customer journey has the biggest issue.
Before diving into optimizing your product, start with the big picture – as defined by your customer journey metrics map – and see which area has the biggest problems and impact on acquisition, retention, revenue, or whatever your focus is right now.
Let’s assume that you’ve looked at your key areas and their respective metrics, and you notice that you have a problem with onboarding – your product analytics tool is flagging that for you. Let’s look at how you tackle that, step by step.
Example: How to optimize your SaaS onboarding process using product analytics
The onboarding process starts the moment a person creates an account, and is completed when the customer has experienced the promise of your product for the first time.
The promise of your product is the value that the customer can gain as a result of using your product or service.
The onboarding process also includes “technical” requirements that users need to complete to experience the value of your product. E.g. “adding subscribers” before sending an email campaign.
Once you’ve defined your product’s onboarding process, you should gather your entire team to discuss and agree on it. It’s crucial that your entire team is … well, on board with onboarding, and what the process entails for customers.
Once you’re on the same page on the onboarding definition, go through the framework below to know what needs improving, and how.
To re-emphasize this, with product analytics we’re not just tracking metrics – although metrics are also important – but you are leveraging the power of algorithms to understand patterns, and what influences actions and decisions.
Find out how people are experiencing the promise of your product for the first time
Two simple and quick onboarding metrics you can look at are: “How many users or accounts have started onboarding, and how many have finished it.”
But then you need to dig deeper into the data by analyzing the onboarding time, how accounts convert or drop off during the onboarding process, and what influences their behavior.
Let’s dive in, using product analytics reports to guide us through the onboarding process.
The product analytics report we’ll be looking at: How are accounts converting during the onboarding process?
This pre-built report is automatically mapped to the onboarding process of your users, from the moment of sign up to the moment they experience the promise of your product for the first time.
The onboarding funnel automatically highlights your biggest problem, thus opportunity, in fixing your onboarding process.
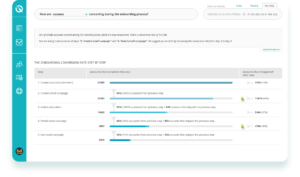
Source – InnerTrends product analytics platform | Pre-built report
You can automatically sync the information of users that drop off during the onboarding process with your marketing automation tool for better recovery campaigns.
Identify the product features that are most likely to help people onboard at higher rates
Knowing the onboarding step where you lose the most accounts is only the beginning of the battle. Knowing which actions and features in your product influence people to finish the onboarding process is the next win you’ll claim.
Next insight you should look for: What actions do accounts perform between the onboarding steps?
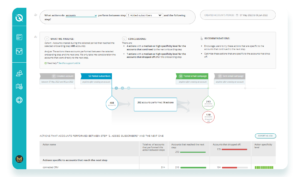
Source – InnerTrends product analytics platform | Pre-built report
Segment the onboarding process performance based on persona or marketing channel that drove people to discover your product.
Discover how long it takes people to experience the value of your product, and time your onboarding emails based on that
Understanding how long it takes to finish the onboarding process is crucial in timing any intervention you’d like to implement through automated email campaigns, manual interaction or other in-product tools.
You can do that by applying the report: How long does it take to onboard a new account?
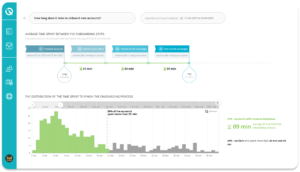
Source – InnerTrends product analytics platform | Pre-built report
See the influence of emails on getting people to finish the onboarding process
Once your email program for optimizing the onboarding process is running, you want to make sure that it’s moving the needle for your business. Monitoring the conversion rate of the emails is not enough, as those conversions don’t really mean anything. Do you care about the emails’ open rate, CTR, or about their impact on onboarding success?
Product analytics lets you see the true impact of your emails by comparing the behavior of people that open emails with the behavior of people that don’t open emails.
This is the type of report you could look at: How do emails influence accounts to finish the onboarding process?
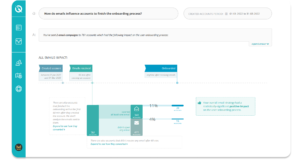
Source – InnerTrends product analytics platform | Pre-built report
Wrap-up
- Product analytics is not just about tracking metrics within your product – it’s about providing meaningful insights into problem areas and steps you can take to improve them.
- Team alignment on the customer journey metrics is crucial. By achieving alignment, you’re making sure that everyone on your team understands what they’re fighting for.
- A correctly implemented data tracking setup is critical in your product strategy – only by getting good quality data will you be able to trust the analysis that follows and find meaningful patterns that will help you understand how your product is used, and how to improve it.
- Even if you are strapped for resources, as a product manager, you’ll understand top priority areas that need fixing for maximum impact. And the product manager isn’t the only team member who’ll benefit from using product analytics – the data insights collected can be used to the advantage of each team in its own way, like customer success, marketing, sales. With product analytics in place, everybody wins.
- The product-led growth model is the business strategy behind many of today’s most lucrative and strongest SaaS companies because it focuses on providing the customer with the best user experience possible. There’s no more agile of a way to learn about your customers than with product analytics.