From how often shoppers make online purchases to how they prefer to get information and what they pay most attention to, there’s a whole lot that businesses need to know about online shoppers in order to sell effectively.
Fortunately, 2Checkout has done the hard work and surveyed buyers, then sifted through the data to come up with some key insights that could transform how you conduct your eCommerce business.
Read on for a quick peek at the when, what, why and how of our latest infographic on online buyer behavior, then check out the full infographic for details on preferred payment and support methods and more.
WHEN
How often do people buy online?
Shopping habits vary widely, with 17% making an online purchase once a week or more often, 26% buying online a few times monthly, 30% a few times a year and 27% buying only once a year.
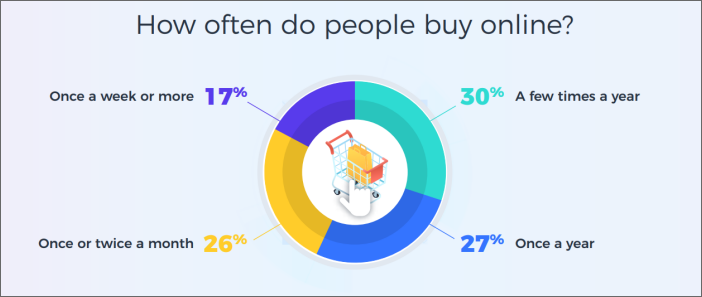
Depending on the type of products or services you are selling, your focus is probably best spent on the 43% of shoppers making an online purchase a few times a month or more often, but keep in mind that less frequent buyers could eventually become part of your customer base as well.
Clearly, you need to go deeper and analyze your client base, understand average order value (AOV) and client lifetime value (CLV) by cohorts, and not just make decisions based on purchase frequency.
WHAT
What are the most popular digital purchases?
Software leads the pack in digital eCommerce sales, purchased by 53% of surveyed shoppers, and it’s followed by mobile apps at 33% and eBooks at 20%.
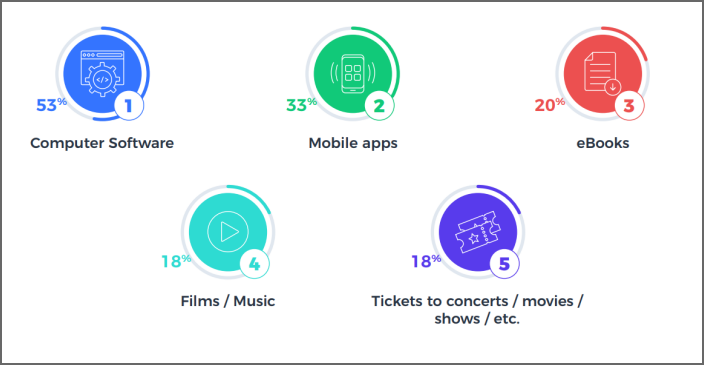
Rounding out the top 5 categories are films or music and tickets at 18% each, showing the growing importance of eCommerce to the entertainment industry.
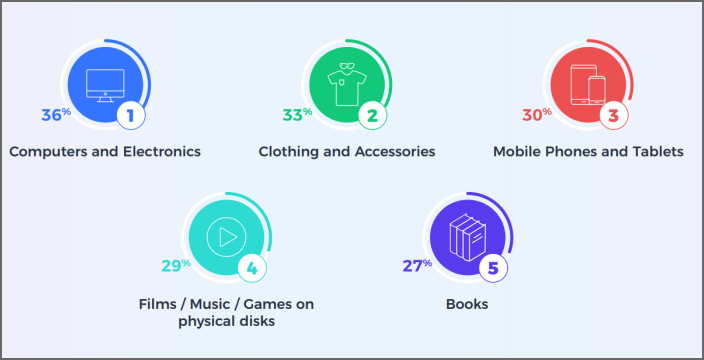
What about physical goods?
eCommerce is obviously not just for digital goods. People buy plenty of physical items online as well, and the types are fairly evenly split. Computers and electronics are the most popular category at 36%, followed closely by clothing and accessories at 33%. Mobile phones and tablets (30%), films/music on disc (29%) and books (27%) are also (still) popular physical items that get purchased online.
And how about subscriptions?
Entertainment continues to dominate subscription sales, representing 36% of online subscriptions, while 33% of people buy subscription-based downloadable software and 18% Software-as-a-Service.
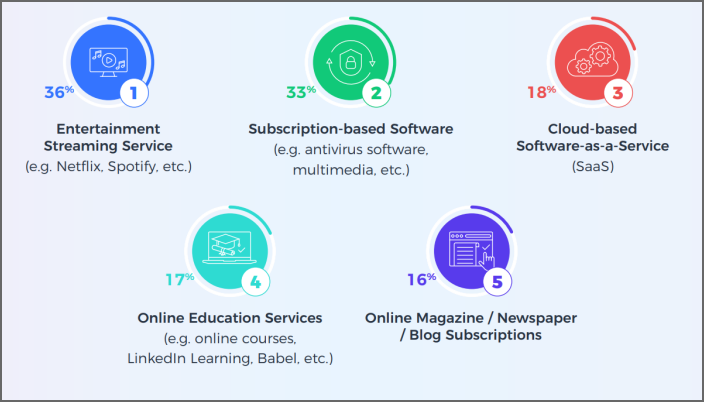
Online education services at 17% and online media (magazine, newspaper or blog) subscriptions at 16% are other popular categories.
WHY
Okay, so you know what sells well—software, entertainment, and computers—but do you know why people buy or don’t buy? Check out some of the most influential reasons for making or abandoning online purchases so you can optimize and expand your business.
Data privacy and security are paramount to shoppers, cited as “very important” by 76% of them. People buying online also seek a good reputation (75%) and clear delivery, warranty and refund policies (73%). Payment method, flexibility, price, and local language are important to more than 60% of online shoppers, too.
When it comes to abandoned shopping carts, reasons vary.
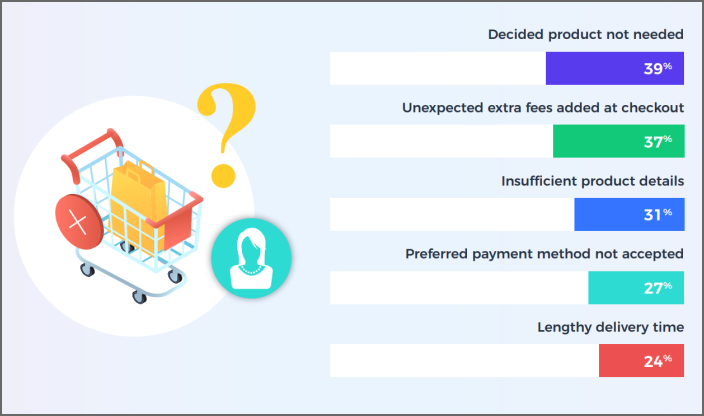
About 39% of shoppers simply decide they don’t need the product, a reality that’s hard to combat. However, 37% abandon carts because of unexpected fees and 31% jump ship due to insufficient product details. These are areas you can clearly address as an eCommerce merchant.
You can also do something about the 27% of shoppers citing preferred payment method not being accepted and 24% noting a lengthy delivery time as reasons for abandoning their online shopping carts.
HOW
The preferred subscription renewal method is in flux, with 61% of shoppers opting for manual renewals and 39% going for auto-renew. This represents some growth in popularity of automatic subscription renewals, which were preferred by just 21% of shoppers in 2018. An explanation would be the proliferation of subscriptions in general and the convenience of auto-renewal.
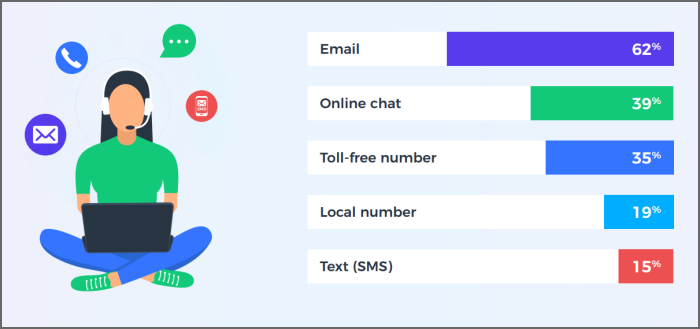
When it comes to getting help related to online purchases, 62% of shoppers still prefer email. Online chat is preferred by 39% of shoppers, while 35% want to call by phone, toll-free. Only 19% of shoppers want a local number and 15% are interested in text messages.
Was this information helpful to you? For more information about online shopper preferences in 2019, check out the full infographic.