Improving your eCommerce store’s UX (user experience) is a long and involved process. It’s more than possible, but you need to understand your users better – and determine ways to improve your site if you want to see good results.
Fortunately, you can use tools like heat maps, which are one of the most used analytics tools in the eCommerce industry, offering you a way to understand how users behave and how certain pages are performing.
Not sure what heat maps are and how they work?
Let us explain how you can use heat maps to ensure an optimized shopping experience for your visitors.
What Are Heat Maps?
Heat maps are graphical representation tools that display website data in a unique way. Instead of having to look at endless spreadsheets or other data representations, a heat map lets you visualize critical concentrations of data as bright spots on a screen following a color-coded system.
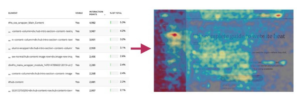
For example, if you have a website heat map depicting where site visitors move their cursors or click most often, the most frequently clicked areas will show up as red or orange. Lesser-clicked areas will instead appear as cooler colors like blue or green or will not have any color.
Put another way; heat maps showcase concentrations of data as “heat” on a screen.

Source: Hotjar
Benefits
Heat maps can provide many major benefits to eCommerce business owners and site operators, including:
- Optimizing your conversion rate. With heat maps, you can figure out the areas of a site or page that resonate most with your site visitors and take practical steps to improve customers engagement.
- Improving the discoverability of certain sections of your website’s pages. Besides visualizing page sections that resonate with visitors, heat maps also uncover the areas with low to no access from users. This might be important to you, either as part of the customer engagement process or as part of your lead generation approach.
- Simplifying numerical data. Heat maps allow you to analyze data without having to grasp complex statistical formulas or analytics methods, enabling you to visually see how people interact with your site rather than having to figure it out by looking at numbers.
- Making it easier for you to understand how visitor data relates to their behavior. Heat maps can help you understand how your visitors react to a product, service, or idea and identify where and when users might experience frustration or might be distracted.
- Helping companies plan their content marketing strategies, project sales, forecast revenues, and cut costs.
Website maps are invaluable for site operators, managers, business owners, entrepreneurs, and everyone in between. It’s just more intuitive to look at heat maps than to look at tons of numbers over and over.
Types of Heat Maps
Heat maps are available from different website tool sets and in many different types. The type of map you use can impact the data you receive, how you interpret the data, and how easy your site is to upgrade.
The most common types of heat maps include:
- Click heat maps. Click heat maps help you analyze which webpage sections receive the most clicks, such as your landing page, contact page, or even product pages.

Source: Hotjar
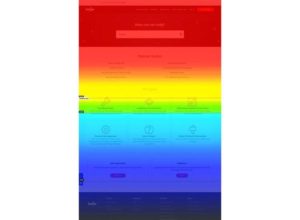
- Scroll heat maps use “warm to cold” color shifts and transitions to indicate how far a viewer scrolls down a given page. Warmer areas of the page show you where most of your website visitors spend most of their time. Colder colors, like green or blue shades, show you which parts of the page or which content is primarily ignored.

Source: Hotjar
- Traffic segmentation heat maps. Traffic segmentation heat maps give you website traffic data and categorize it into distinct demographic customer segments. You can tailor which customer segments you see by factors like age, sex, location, and more.
- Mobile and desktop heat maps. These are dedicated snapshots for desktop and mobile website pages. Using these comparisons, you can see how differently your users interact with your mobile site vs. desktop pages.
- Mouse-tracking heat maps. As their name suggests, mouse-tracking heat maps directly track where users’ cursors go on your web pages. This can tell you how focused or distracted a user is when browsing your site.

Source: Hotjar
All of these listed above can be beneficial, especially if you use them wisely. Sometimes, interpreting the heat map results can be as difficult as learning a new language. You want to make the best out of every tool you integrate in your eCommerce business, so we advise you to closely research the types you are going to use and take time analyzing the information they provide.
How To Use Heat Maps & Interpret Their Results
The following tips can help you to use heat maps strategically and easily identify ways to improve your business:
- Use heat maps on the right pages. Ideally, you should use them on your most trafficked pages; the more data you have, the better you can use the heat maps to understand your visitors’ behavior patterns.
- Discover how visitors make purchases on your eCommerce store. This can help you improve your product pages and drive more sales.
- Optimize your calls to action. If, for example, you find that a call to action on a webpage doesn’t get a lot of attention, move or upgrade it and see if that results in an improvement.
- Learn which of your site’s areas get the most attention from your visitors. This will allow you to improve how content is displayed on the page and position important elements where they get maximum exposure. Optimizing each page based on user behavior will help boost engagement and drive more sales.
- Discover usability or navigation issues on your site. For example, if you notice a drop in user engagement (like a decline in clicks), heat map data can help identify any unusual activity you should investigate further.
- Heat map data can indicate if customers are struggling with navigating the checkout page and completing their purchases. Use this data to identify the “dead elements” on your checkout page that receive little attention but take up valuable real estate and replace them with something more engaging and valuable.
- Check which payment methods buyers use the most to make their purchases. This can help you further prioritize your checkout page while cutting costs at the same time. You can eliminate payment processors you don’t need while focusing your resources on innovative infrastructure like digital wallets to accept and store crypto and other digital assets.
- Use heat maps to analyze how users behave on different devices, like smartphones vs. desktop computers. You may need to unify the user experiences if there are major differences.
 Source: Hotjar
There are situations when a heat map analysis isn’t going to provide a clear enough path to improving your conversion rate. Try to expand your research with the session recordings, as most heat map tools also store recordings of visitors’ specific movements on your site. They might take some time to analyze, but a customer-centered business is going to benefit a lot from valuable insights given by watching your customer’s specific behavior on your website.
For a better understanding..
Any business with an online presence can benefit from the insights drawn from heat maps and session recordings. Regardless of the type of digital touch point, whether a presentation site, an online shop or a mobile app, these types of analytics tools can uncover valuable insights that will help you optimize your users’ journey towards the conversion point. Let’s look at some examples:
Credit card company re:member leveraged HotJar’s heat map and recordings solution to discover what important site information visitors were overlooking, what areas users expected to click that weren’t clickable, and what happened when users encountered an error in their site flows. Findings from this deep dive led to site optimizations that increased applications for the company by 43%. Read the full case study from Hotjar.
Leather bag manufacturer Bros Leather Supply Co used Sumo’s eCommerce analytic tool to uncover visitors’ interest in qualitative product images. The findings from their experiments allowed the producer to invest more in the type of visuals included on product pages, thus optimizing the user experience on the site. Read the full case study from Sumo.
Conclusion
Heat maps are invaluable tools you should not ignore. When leveraged properly, heat maps can help you better understand your website visitors and allow you to improve and streamline your site for major conversion boosts.


